Reported UFO Sightings in Australia
Reported UFO Sightings </>
This week’s Tidy Tuesday data comes from NUFORC and includes more than 80,000 recorded UFO sightings around the world. I had a lot of fun with this, especially reading some of the descriptions from reported sightings in Australia:
“It was a huge black round thing and it was leaving a green trail of smoke behind it. It made a buzzing sound.”
“A brilliant blue-white light performs amazing acrobatics for an hour and a half over the city of Brisbane.”
“Fireballs dance in the sky over Sydney, Australia”
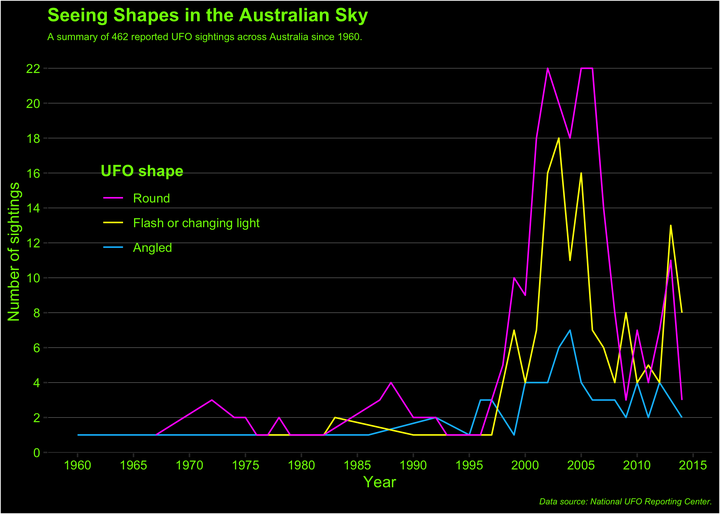
I was interested in the shapes people were reporting, as it wasn’t all just discs or flying saucers. People reported seeing eggs, triangles, formations, cigars and more.
To get a better sense of the shapes, I decided to group them into three categories - I am not sure I really did this grouping enough justice, to be honest, but I do think it managed to simplify the shapes for a graph format. Here’s my code for grouping the shapes:
#sort UFO shapes sighted in Australia into three categories and sort by decade:

ufo_aus_year <- ufo_sightings %>%
  filter(country == "au") %>%
  mutate(shape = case_when(
    ufo_shape %in% c("cylinder", "cigar", "dome", "circle", "teardrop", "fireball", "egg", "sphere", "disk", "round", "oval", "crescent") ~ "Round",
    ufo_shape %in% c("diamond", "hexagon", "rectangle", "chevron", "triangle", "cross", "pyramid", "delta", "cone") ~ "Angled",
    ufo_shape %in% c("light", "flash", "changed", "formation", "changing", "flare") ~ "Flash or changing light")) %>%
  select(date_time, shape, longitude, latitude) %>%
  mutate(year = as.numeric(format(as.Date(date_time, format = "%m/%d/%Y"),"%Y"))) %>%
   filter(shape != c("NA", "other")) %>%
  count(shape, year)
Alternatively, I could have put a Top 10 list together (added below), but I didn’t have time to think about how to properly visualise it.
## ufo_shape n
## 1 light 119
## 2 circle 62
## 3 disk 50
## 4 triangle 43
## 5 fireball 34
## 6 oval 30
## 7 unknown 25
## 8 other 22
## 9 formation 20
## 10 cigar 15
## 11 sphere 15
## 12 egg 12
## 13 diamond 10
## 14 rectangle 10
## 15 teardrop 10
## 16 changing 9
## 17 cylinder 9
## 18 cone 6
## 19 flash 4
## 20 chevron 3
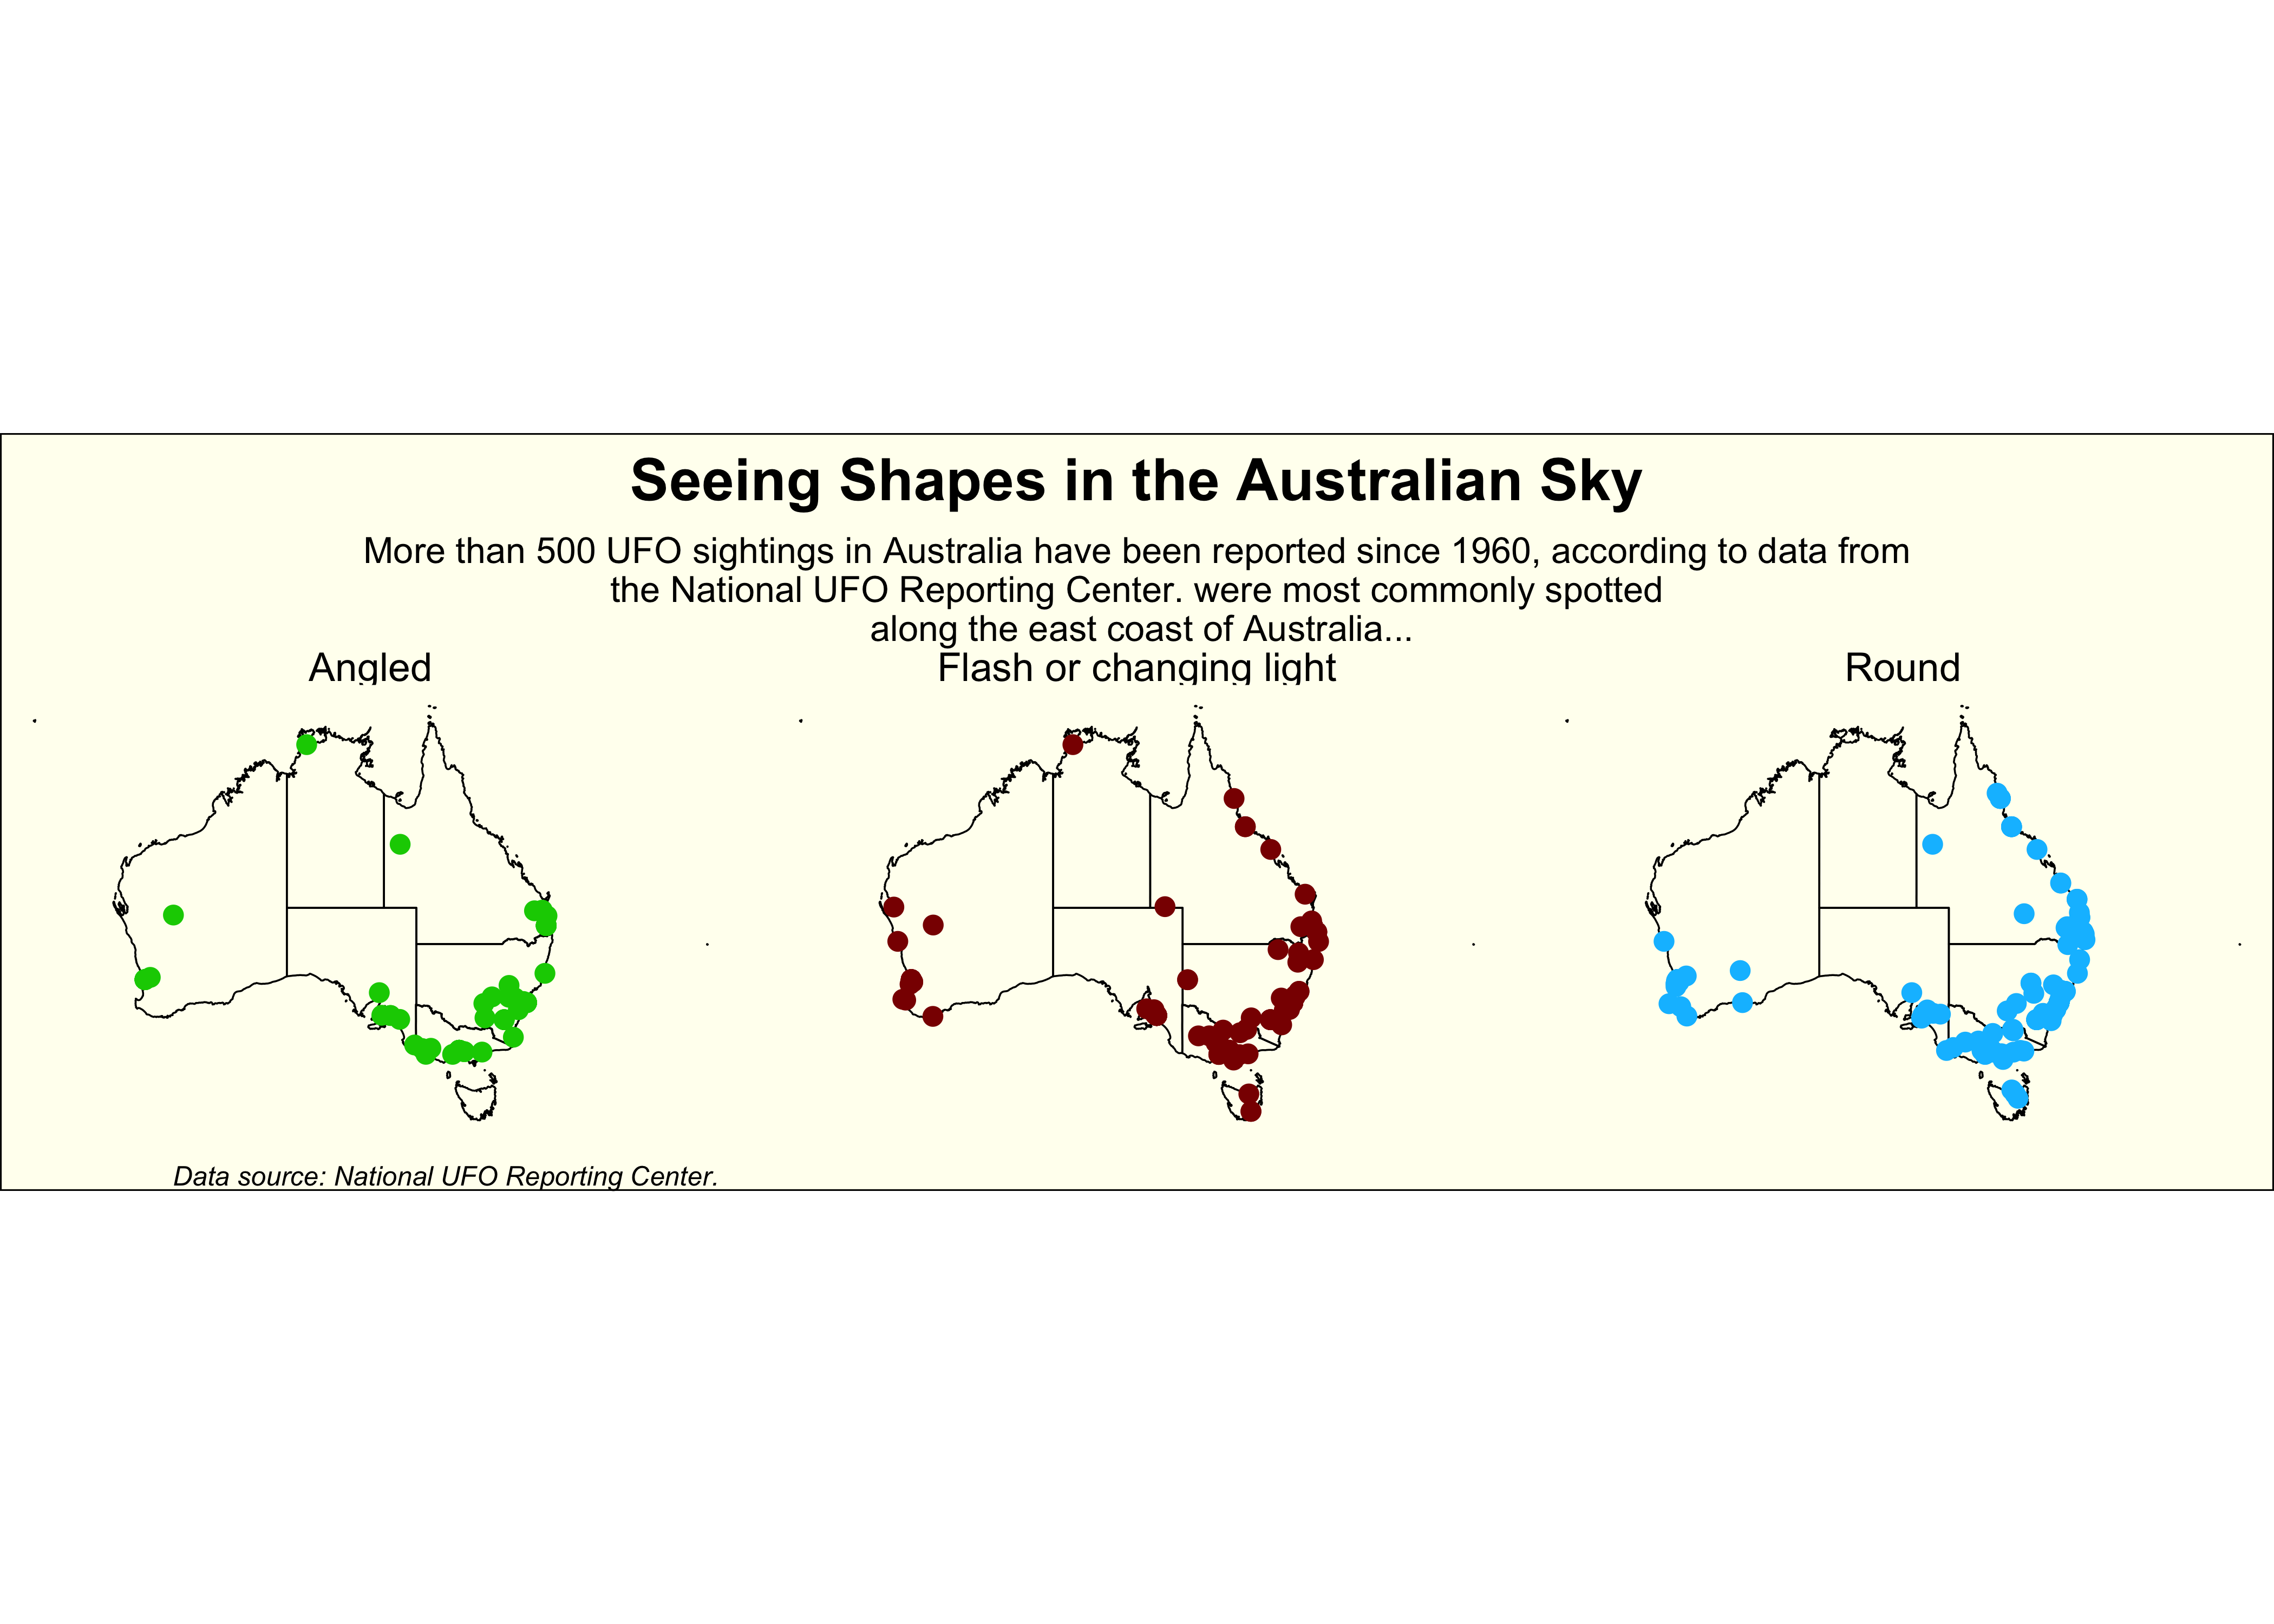
## 21 cross 1I also attempted to map the sightings of these three shape categories to a map of Australia. I was super excited to learn how to use a map to portray data, but I think I should have used different data to map, or made it more interactive or looked at the data at state level (QLD, NSW e.t.c.,) so it was clearer where these sightings were reported.
Another fun idea I had was to overlay flight path data to the map to see if any of the reported sightings, especially light/flare sightings, were near a flight path. But that could be for another time.
Here’s my first attempt at using a map in my visualisations!