U.S. Populated Places
U.S.Populated Places </>
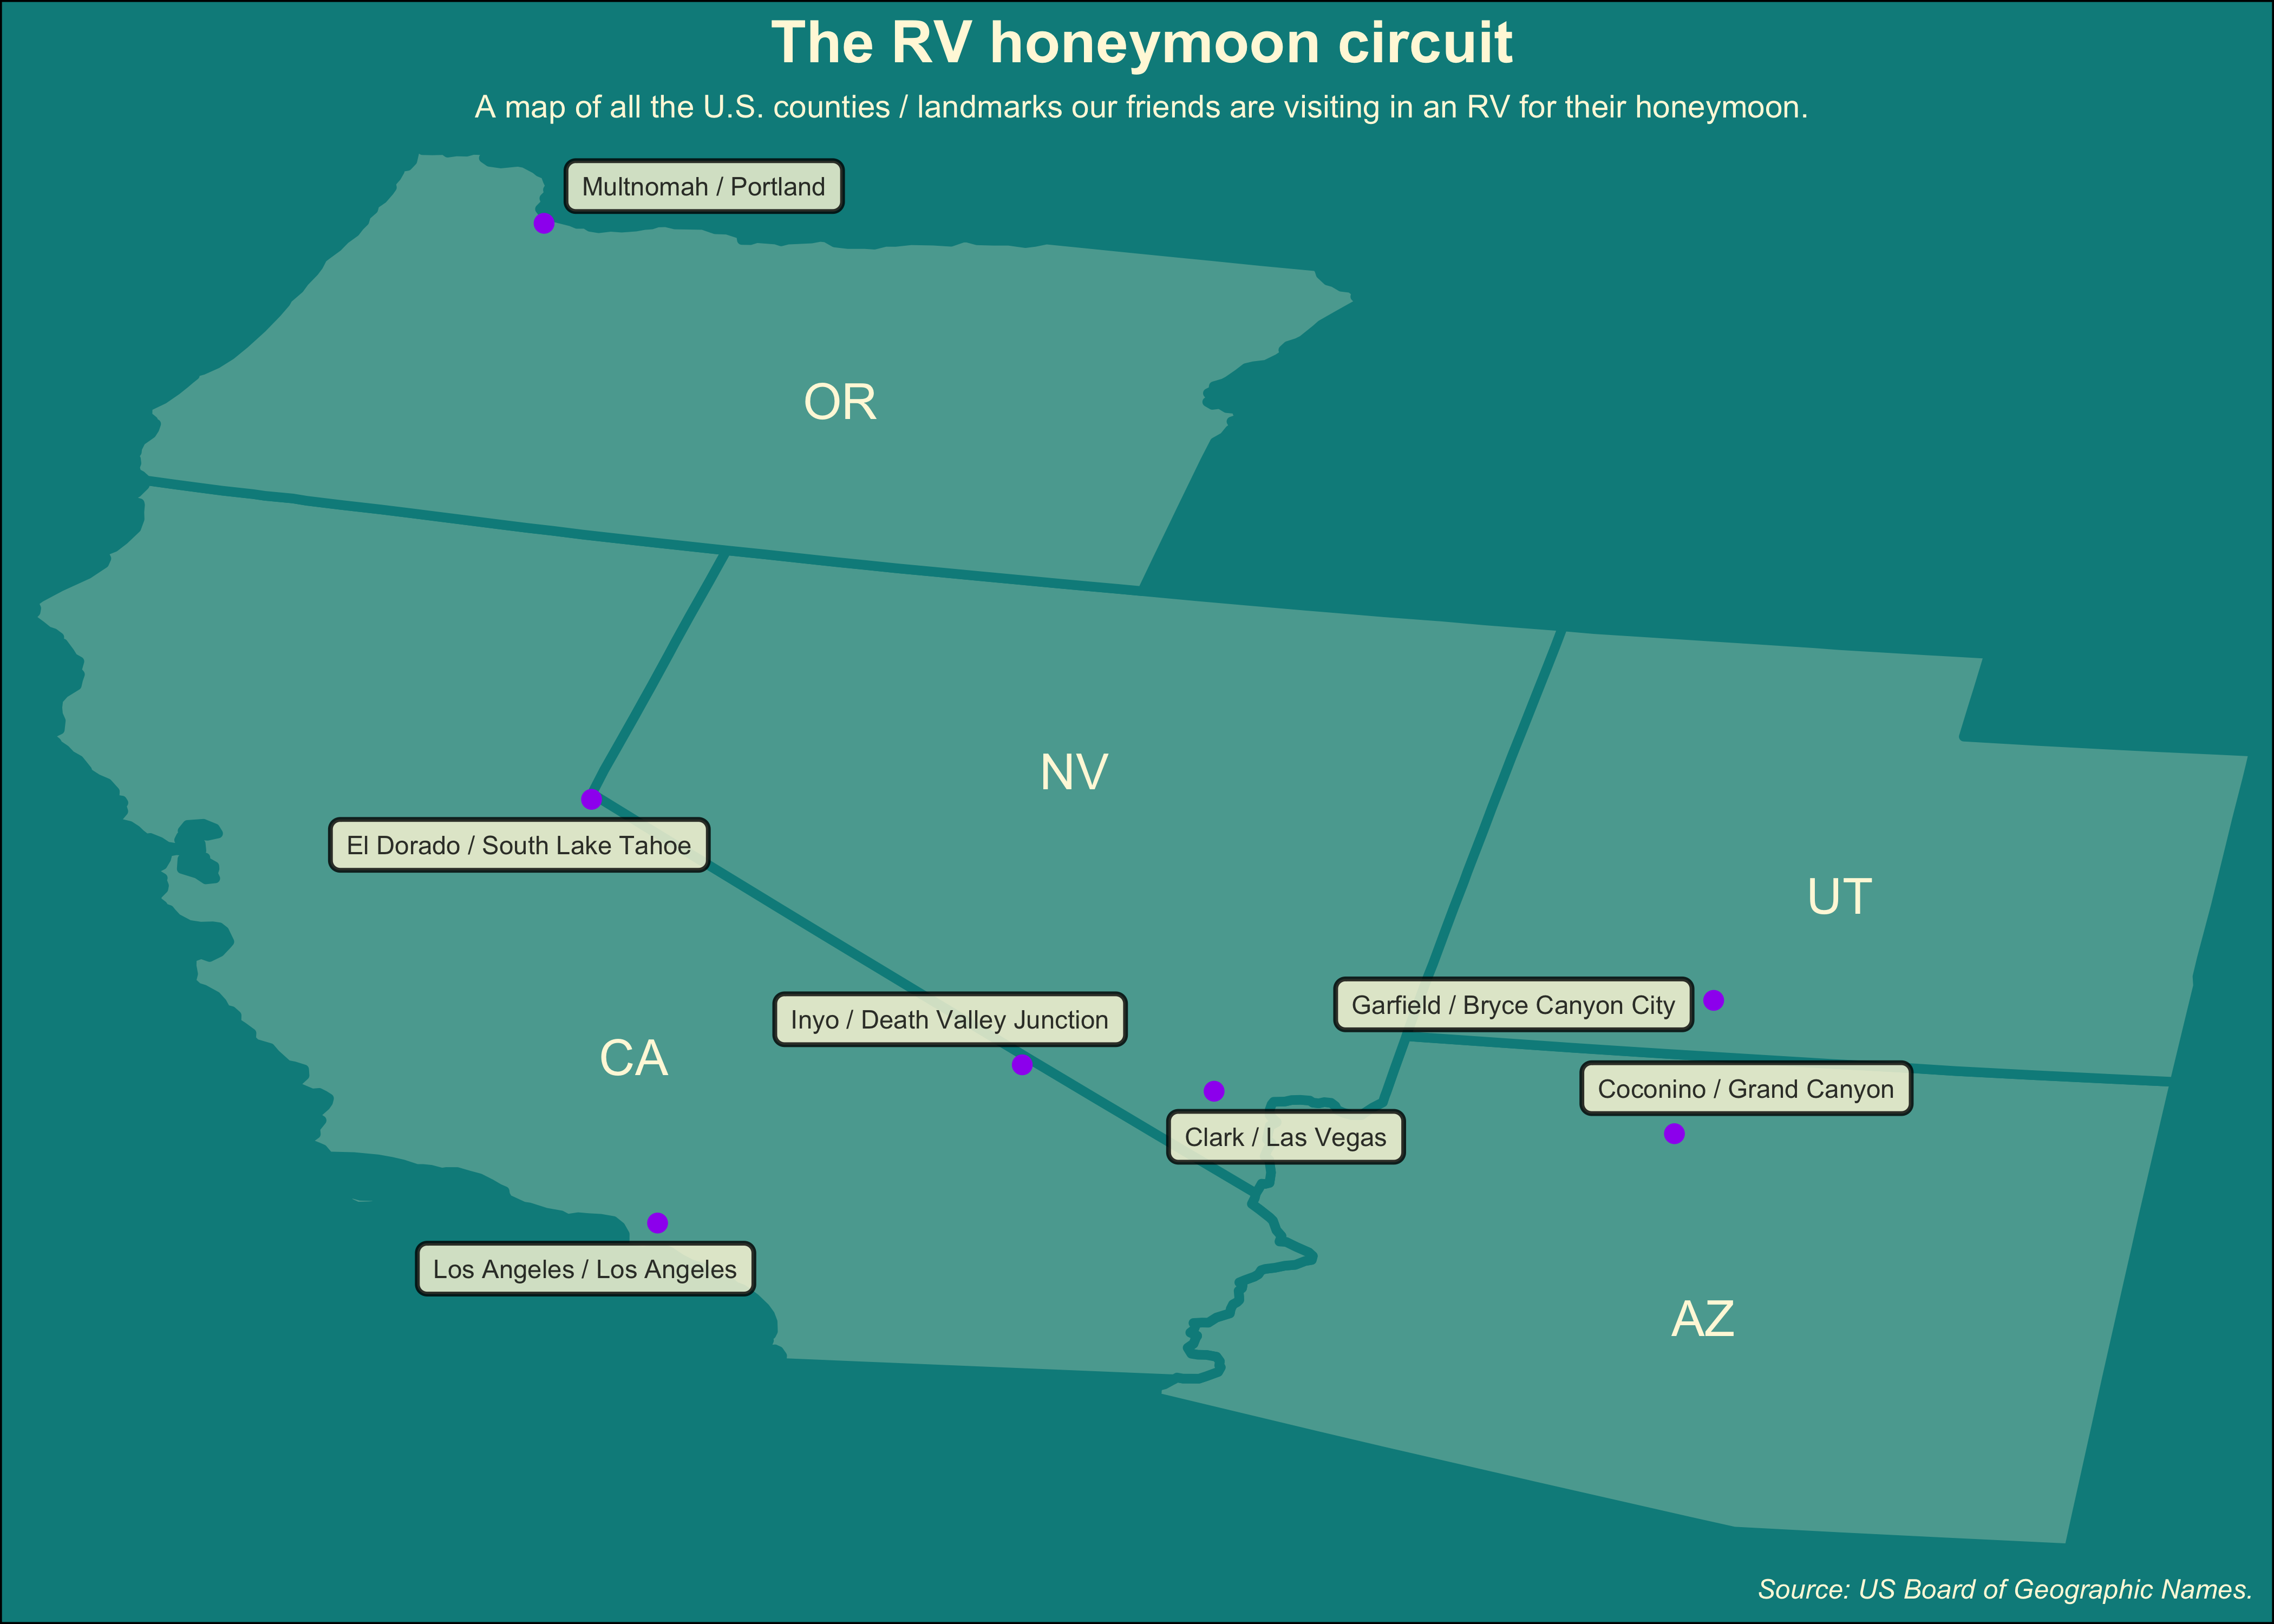
Data this week comes from the National Map Staged Products Directory from the US Board of Geographic Names..
This was a fun #TidyTuesday data set to work with because it timed well with some friends who flew to the U.S. last week to have an Elvis wedding in Las Vegas 💞
They’re renting an RV and hitting the road, with plans to stop at a few major national parks in the area, so I thought I would use their honeymoon travel itinerary as a guide to visualising this week’s U.S. Populated Places data.
Using the usmap package was a little tricky, as I had to transform my data so I could plot it properly. I think after my attempt at using a different maps package to plot reported UFO sightings in Australia last week, I might need to try out ggmaps to see if it’s a little more streamlined.
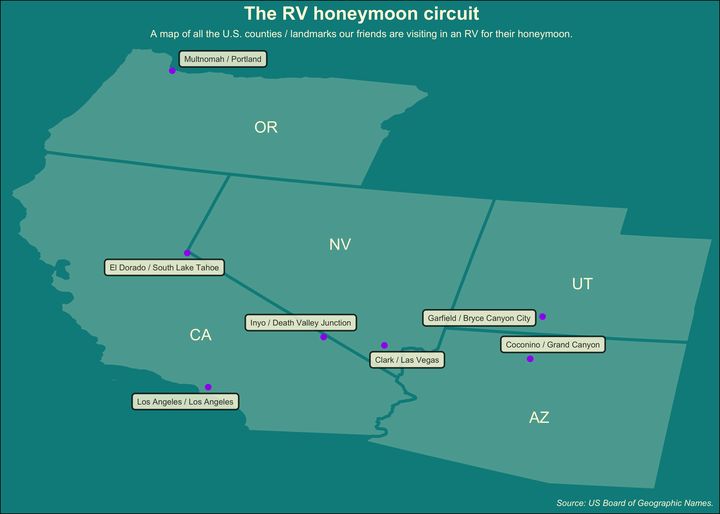
I had such a hard time trying to work out why there was so much blank space around my map, see here:
 But, after A LOT OF GOOGLING, I found this:
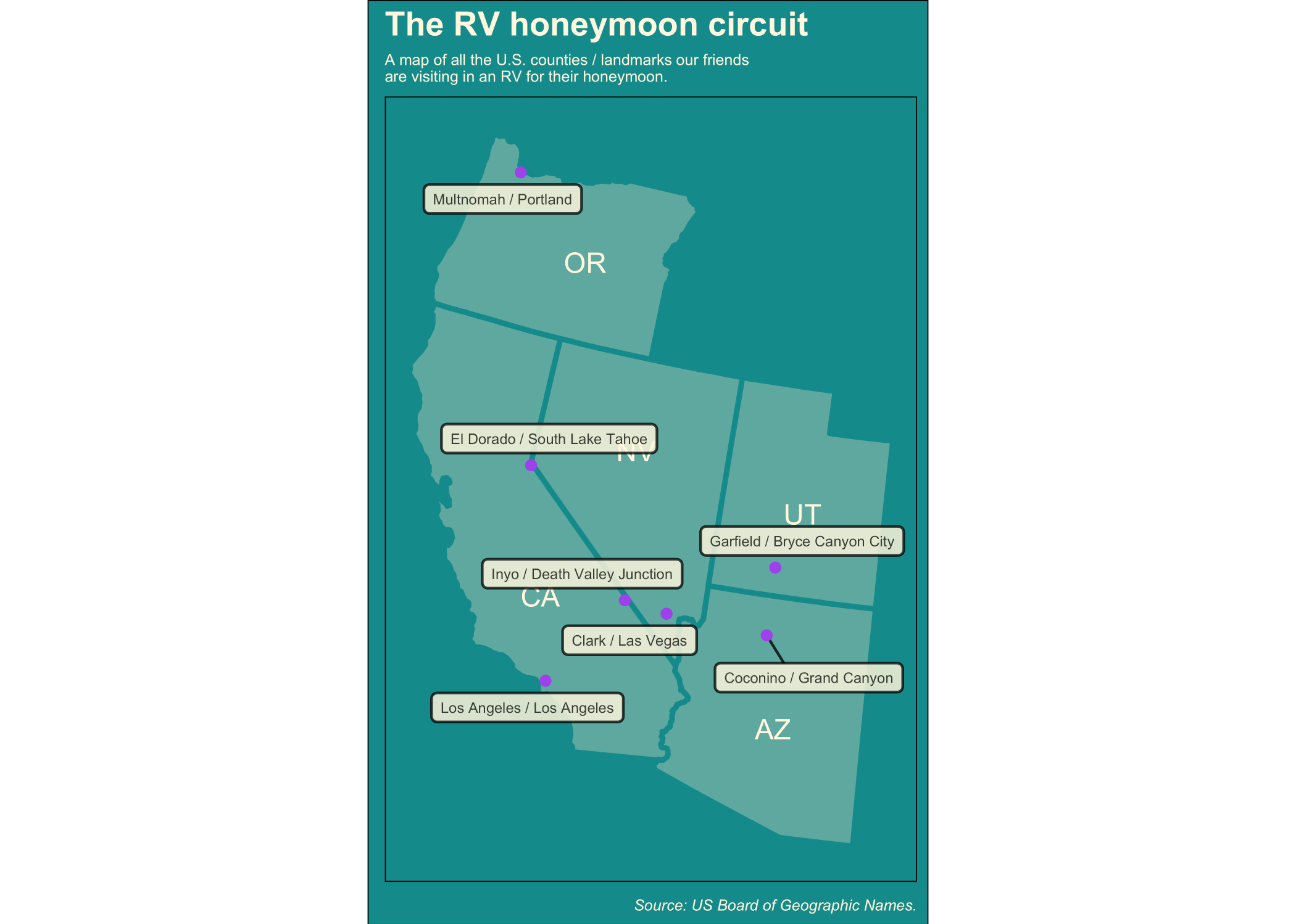
The Cartesian coordinate system is the most familiar, and common, type of coordinate system. Setting limits on the coordinate system will zoom the plot (like you’re looking at it with a magnifying glass), and will not change the underlying data like setting limits on a scale will. Via this ggplot2 ref. site
So I added coord_cartesian() to my ggplot and voila! I now need to do some digging into how EXACTLY this works 😅