People living in severe, extreme, or exceptional drought in the western states of the U.S.
U.S. drought: The number of people living in the western states of the U.S. impacted by drought </>
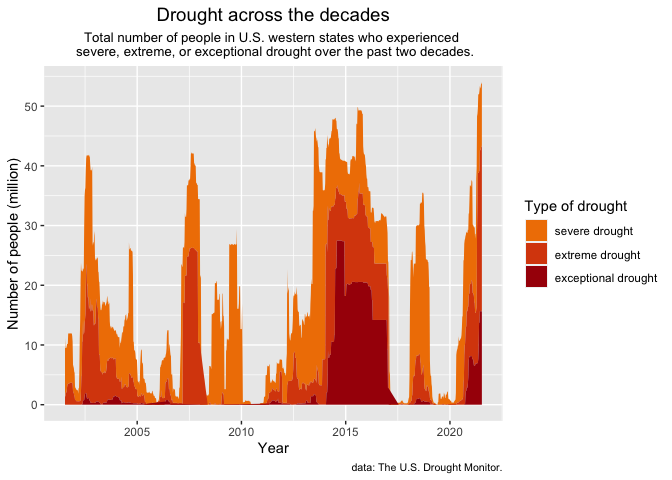
This week’s Tidy Tuesday data comes from the U.S. Drought Monitor.
The dataset details the drought level across U.S. states from 2001-2021. I wanted to look at the number of people who have experienced severe, extreme, and/or exceptional drought conditions over this time in the western states of the U.S.
This one was a bit tricky. I wanted to show the impact of people affected by severe+ drought and decided to use the western states as an example because on first glance, that area seemed to be hit quite hard with drought over the years.
Using the pop_pct would have been a lot easier to read at graph level, but I struggled to work out how I could add % of pop. for each drought level by each week to create the graph I wanted.
The outcome was a stacked graph that ended up looking quite messy. This was a good learning curve.
Data Reference: The U.S. Drought Monitor is jointly produced by the National Drought Mitigation Center at the University of Nebraska-Lincoln, the United States Department of Agriculture, and the National Oceanic and Atmospheric Administration. Map courtesy of NDMC.
